A Project Management Gantt Chart is a tool that guides the project team to plan, make a timetable, and keep a check on the tasks. It is the best and easiest tool in project management to properly show the tasks, the time given to each task, and contingency.
Gantt Charts are important in project management as they help distribute the bigger and tougher tasks into small parts with a clear time given to each small task. They guide the PMP project managers and the team in finding out the delays, checking up on the progress, and being flexible with the timetables as the need arises. Either it is a small or a large project, a properly maintained project management Gantt chart helps everything work well and on time.
Project Management Gantt Chart Key Takeaways:
- A Gantt Chart is a seeable chart that helps to plan and keep a check on the project every time.
- It shows the tasks, timetable, tasks that are dependent, and end dates, making it easier to understand the progress of the project.
- The Gantt Chart tool helps divide the tough projects into small parts and allocates proper end dates to each task.
- The critical path in a Gantt chart is the important tasks that need to be completed on time.
- The Gantt Chart builds togetherness among the team and develops strong communication.
- It helps the project manager to figure out any issues or delays, handle risks, and adjust the time allotted to each task accordingly.
- Tools like Microsoft Project, Asana, Microsoft Excel, and Monday.com can be used to create and manage Gantt charts.
What is a Project Management Gantt Chart?
A Gantt chart is one of the best project management tools that aids in planning and monitoring a project’s timeline. It shows the task patterns and the expected time line.
Tasks are shown in horizontal bars in a Gantt chart, which shows the progress, contingency, and start and end dates. Its main job is to designate tasks to team members and mark the end date for each task.
A Gantt chart guarantees that projects for big teams and numerous stakeholders stay on course. It’s an excellent tool for time management and progress tracking.
What Is The Use Of Gantt Chart in Project Management?
In project management, Gantt charts are very helpful. This tool helps in checking the progress of the project. Gantt charts show planned activity against time. Here are the uses of the project management Gantt chart below:
-
Making a Timetable for the Tasks
Gantt Charts help project managers to make an easy timetable for each task by mentioning the start and the end dates, making sure that each of the tasks is finished on time.
-
Check on the Progress
The team checks on the progress of each task and figures out delays, if any.
-
Handling Resources Well
A Gantt Chart helps the project managers to distribute funds and make sure that the right amount of manpower and materials are allotted to each task and at the right time.
-
Critical Path Analysis
Gantt charts assist in finding the critical path, which is the longest series of jobs that must be completed on time to avoid any delay throughout the project life cycle.
What are the Components of the Project Management Gantt Chart?
The Project Management Gantt Chart is made up of 9 components or elements, they are:
1. Dates
The dates are one of the primary elements of a Gantt chart, which gives project managers the ability to see not only the start and finish date of the overall project but also the dates of each task. These are shown along the chart’s top part.
2. Activities/Tasks
Tasks refer to specified tasks or work items required for project completion. A Work Breakdown Structure is commonly used for dividing each task.
3. Timeline
The timeline shows the project duration, including start and finish dates for each job and overall project.
4. Taskbars
While many subtasks can be performed rapidly, there will be occasions when you want to know exactly how your project is progressing. The progress is checked by coloring the tasks chart to show how much of the work is done.
5. Milestones
Important events or time table in the project that show the important achievements, like different parts of projects, approvals, or delivery time.
6. Critical Way
The longest series of dependent tasks determines the shortest time required to accomplish the project. Any delays on the crucial path will cause the entire project to be delayed.
7. Progress Indicators
Gantt charts usually show progress stats or shade them to present how much work has been completed and what are remaining. This assists in tracking progress.
8. Resources
This point lists the names of the team members against the tasks assigned to them to make it simpler to understand. This way, it allows you to successfully manage people, tools, and talents while completing each project on schedule.
How to make a Project Management Gantt Chart?
To make sure your project management Gantt chart becomes a better project tool for you, we will learn the important steps, from the scope of the project to tracking the progress.
1. Identify Project Tasks
The initial step is to break the projects into small tasks that are to be completed. Making a Work Breakdown Structure usually benefits as it divides the work into different times and duties.
2. Define Tasks Duration
Once you have marked up all the tasks, make an assumption on how every task will take to complete. This defines the task duration. Preparing beforehand the start and the end dates for every task helps you to understand the actual time a project will take to finish. It also helps you manage resources and reduce delays.
3. Establish Task Dependencies
Some jobs cannot begin until another one is performed. This is known as a task dependency. For example, you cannot begin painting a house until the walls have been erected. Establishing these dependencies allows you to better structure the project workflow and avoid confusion. It also guarantees that things are executed in the correct order without generating delays.
Common dependencies are:
- Finish-to-Start (FS): Task A must finish before Task B starts.
- Start-to-Start (SS): Tasks A and B start together.
- Finish-to-Finish (FF): Task A must finish before Task B can finish.
- Start-to-Finish (SF): Task A must start before Task B finishes.
4. Figure out the Milepost
Milestones are important accomplishments in a project that show immense progress. These mileposts help you to check the progress and keep everyone motivated to finish the tasks better.
5. Build the Gantt Chart
After all these, it’s time to create a project management Gantt chart. To get this, use tools such as Microsoft Project, Excel, Asana, or Monday.com. The Gantt chart imagines and shows your tasks on a time line. Each job is displayed as a horizontal bar with a start and end date. Dependencies are shown by arrows connecting tasks. Thus, this helps you understand the full project flow.
6. Assign resources
The next step is to assign people, materials, or equipment to each task. This guarantees that the proper resources are assigned to the right tasks at the right time. For example, if you’re creating a website, you may assign a designer for UI/UX and a developer for coding. Proper resource allocation keeps the project running smoothly and without delays.
7. Track your progress
As work progresses, the Gantt chart should be updated regularly to show how much work has been performed. Furthermore, tasks can be marked as in progress, completed, or deferred. This allows you to detect any barriers early and make adjustments as needed. Tracking progress keeps your team and stakeholders informed.
8. Monitor the Critical Path
The critical route consists of tasks that directly affect the project’s completion deadline. If any of these jobs are not on time, so will the entire project. For example, if roofing work is late, interior work will also run late. Keeping an eye on the vital path allows you to prioritize important work and avoid delays.
9. Share and communicate the Gantt chart
Finally, share the Gantt chart with your team, stakeholders, or clients to ensure that everyone understands the project plan. Sharing keeps everyone updated on progress, deadlines, and changes. Most Gantt chart systems provide real-time updates, ensuring that everyone is on the same page and working together to complete the project successfully.
Examples of Project Management Gantt Chart
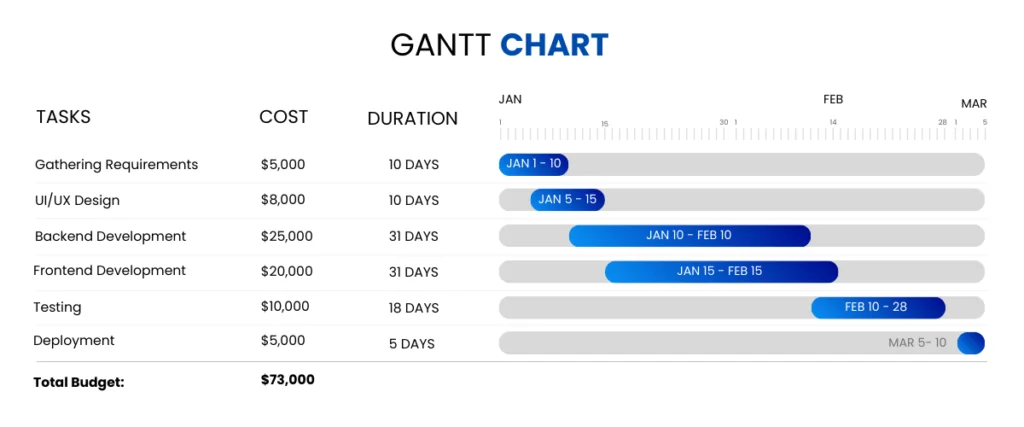
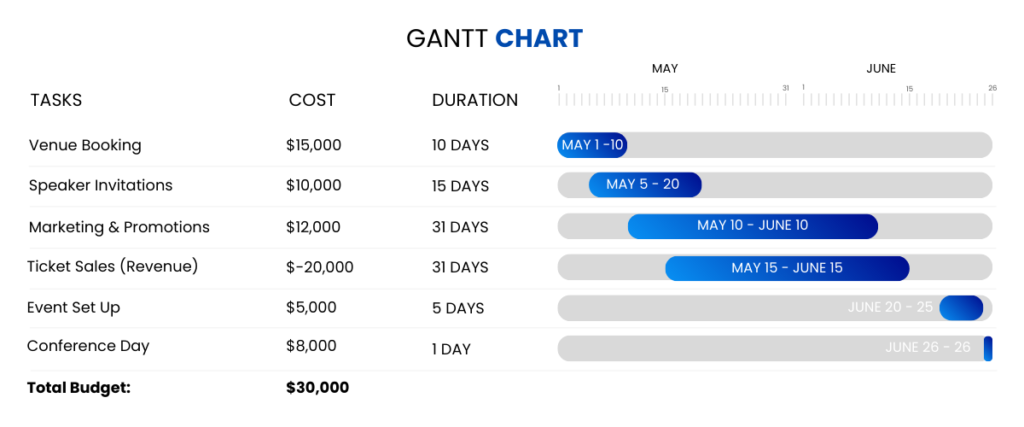
We generated 3 Gantt chart examples to demonstrate how Gantt charts can help to manage various sorts of projects. These Gantt chart examples demonstrate a timeline for software development, construction, and event planning projects.
These Gantt chart examples clearly show:
- The tasks/ activities in the project
- The start date of each task
- The end date of each task
- The duration of each task
- The budget for each task
1. Gantt chart for a Software Development Project
The initial step in a software project is to gather requirements, which involves interacting with stakeholders to understand the objectives, scope, and user needs. Then the development processes can begin. With multiple teams managing different aspects of the software project, the tasks can overlap and go on simultaneously, which we’ve shown in this particular example.
2. Gantt chart for a Construction Project
In the diagram below, we’ve shown a Gantt chart following a similar template as above for a construction project. Here, site preparation, which involves clearing the land, leveling the ground, and establishing utilities and access roads, is the first step. Once the site preparation is complete, the rest of the tasks follow as shown in this Gantt chart example.

3. Gantt chart for Event Planning Projects
The first phase in conference planning is venue booking, which involves selecting and securing a place based on capacity, amenities, and budget. Without a confirmed venue, additional planning factors like logistics and promotions cannot proceed. Hence, based on this, the project can look something like this:
Conclusion
A project management Gantt chart brings structure to projects by mapping out tasks, deadlines, and dependencies in a clear timeline. To put it simply, it removes the guesswork from project planning and makes it much easier to manage, no matter the project size. Project managers can create useful and practical Gantt charts following our guide above.
Frequently Asked Questions:
1. What is a Gantt chart in project management?
A project management Gantt chart is a seeable time table that shows project tasks, when they will start and end, and how they are completed over time.
2. What are the 7 important elements of a Gantt chart?
- Activities or Tasks
- Dates/ Timetable
- Start and Finish dates
- Time limit for each task
- Dependencies of tasks
- Mileposts
- Progress
3. What is a milestone in a Gantt chart?
A milestone is an important landmark in the project that shows important progress, like finishing a part of the project.
4. What is the full meaning of Gantt?
A Gantt chart is named after Henry Gantt, who introduced it.
5. Which tool is used for a Gantt chart?
Tools that are used for Gantt charts are Microsoft Project, Excel, or other project management tools.
6. What is another name for a Gantt chart?
It can also be called a bar chart
7. What is the main purpose of using a Gantt chart?
The main reason for using a Gantt chart is to plan, make a timetable, and check on the project tasks easily, to keep it more understandable.